Advent of Code’s day eleven puzzle asks us to compute a three hundred square grid of values and to find the three by three sub-grid that contains the highest sum of values. In my heart of hearts I knew that this would be a problem well suited to the J programming language.
I started by working on a verb to break a grid into a number of sub-grids of a given size. This reminded me quite a bit of Elixir’s Enum.chunk_every/4 function, so I decided to name it accordingly:
    grid =. 5 5 $ i. 25
    grid
 0  1  2  3  4
 5  6  7  8  9
10 11 12 13 14
15 16 17 18 19
20 21 22 23 24
    chunk_every =. [ <\"2 [: |:"2 [: > <\
    3 chunk_every grid
┌────────┬────────┬────────┐
│0 5 10  │1 6 11  │2 7 12  │
│1 6 11  │2 7 12  │3 8 13  │
│2 7 12  │3 8 13  │4 9 14  │
├────────┼────────┼────────┤
│5 10 15 │6 11 16 │7 12 17 │
│6 11 16 │7 12 17 │8 13 18 │
│7 12 17 │8 13 18 │9 14 19 │
├────────┼────────┼────────┤
│10 15 20│11 16 21│12 17 22│
│11 16 21│12 17 22│13 18 23│
│12 17 22│13 18 23│14 19 24│
└────────┴────────┴────────┘
To be totally transparent, I originally came up with this verb by tinkering in the REPL, and converted it into a tacit verb after the fact.
Now that we have chunk_every, we can define a few more needed values, like our initial grid, our grid size, and our grid serial number:
    size =. 300
    grid =. (size,size) $ i. size * size
    grid_serial_number =. 9424
The puzzle tells us how to convert our initial grid’s x/y coordinates into “fuel cell values”. Let’s write an init verb that takes our initial verb and calculates and populates those values:
    init =. 3 : 0
      'cy cx' =. (0,size)#:y
      rack_id =. cx + 10
      power =. rack_id*cy
      power =. power + grid_serial_number
      power =. power * rack_id
      power =. 10 | power <.@% 100
      power =. power - 5
      power
    )
Now we’re ready to start. We’ll begin by generating our grid of fuel cells:
grid =. init"0 grid
Next, we’ll break our grid into three by three chunks:
chunks =. 3 chunk_by grid
Once we have our sub-grids, we’ll calculate the sum of each and flatten that into a one dimensional array of sums:
flat_chunks =. , +/"1 ,"2 > chunks
And find the maximum sub-grid sum:
max =. >./ flat_chunks
And the corresponding index of that maximum sum:
highest =. flat_chunks i. >./ flat_chunks
Finally, we can turn that index into a pair of x/y coordinates:
|. (0,(size-2))#:highest
This is the answer to our puzzle. Victory!

Our fuel cells, visualized.
Just for fun, we can check out what our newly initialized fuel cell matrix looks like with the help of viewmat. We can see some cool Moiré patterns in the resulting visualization as a side effect of our calculations.
Part Two
Part two wants us to vary the size of our sub-grids, and find the sub-grid size, and x/y coordinate pair that has the most amount of available fuel, or the highest sum.
My first instinct was to run chunk_by multiple times against chunk sizes ranging from 1 to 300:
chunks =. (grid&(<@:chunk_by~))"0 (1 + i. size)
I wrote a verb to count the amount of available fuel within each new set of sub-grids, and ran that against all of the sub-grid sets I was generating:
    count =. 3 : 0
      chunks =. > y
      chunk_size =. # 0 0 {:: chunks
      flat_chunks =. , +/"1 ,"2 > chunks
      max =. >./ flat_chunks
      highest =. flat_chunks i. >./ flat_chunks
      coord =. |. (0,(size-(chunk_size-1)))#:highest
      max;coord,chunk_size
    )

    counts =. count"_1 chunks
From there, I could grab the best score of all of the sub-grid sizes, find the max, and return a tuple of that winning sub-grid’s size, and its x/y coordinate:
    scores =. > 0 {"1 counts
    idx =. scores i. >./ scores
    1 {:: idx { counts
Unfortunately, this turned out to be too slow of a solution.
Thankfully, there were some patterns to be found that let us speed things up considerably! If we plot our counts with a max grid size of 10, 50, and 100, we can see that our score always peaks almost immediately. We don’t need to test larger sub-grid sizes because we know our answer won’t be there.
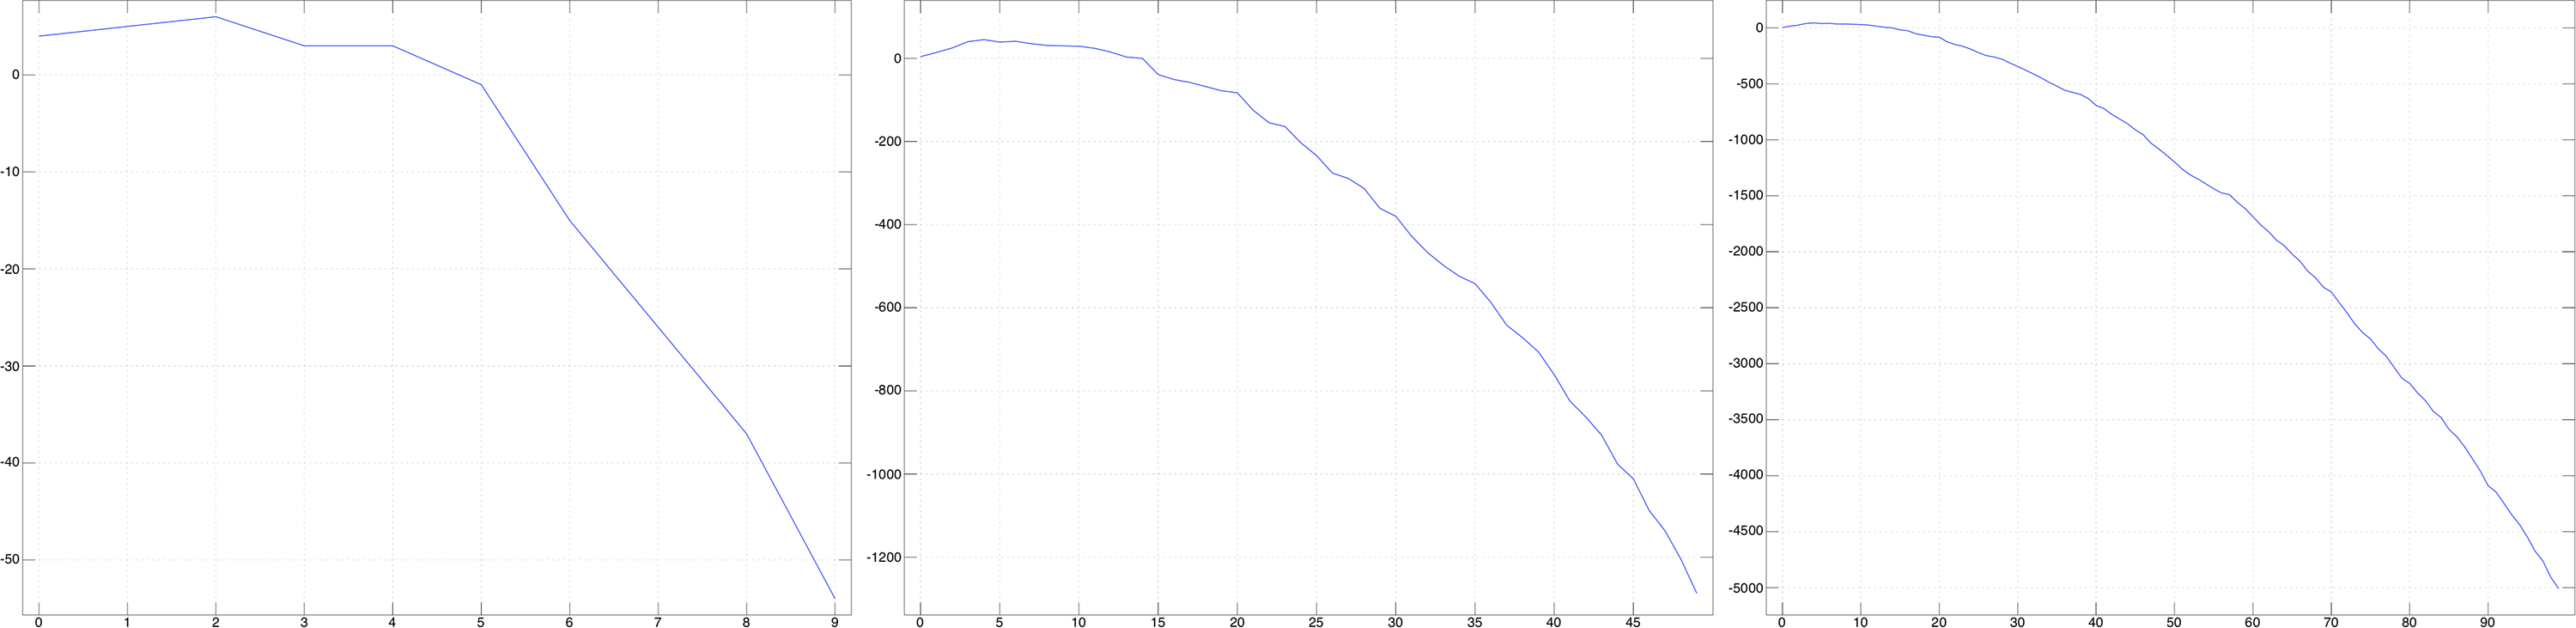
A plot of our sub-grid size vs our maximum fuel availability.
Let’s change our solution to only check sub-grid sizes from one to twenty:
chunks =. (grid&(<@:chunk_by~))"0 (1 + i. size)
And just like that, we get an answer almost immediately.
Thanks J!